Review
Similar Products
|
Addgene inc
pires egfp pac Pires Egfp Pac, supplied by Addgene inc, used in various techniques. Bioz Stars score: 93/100, based on 1 PubMed citations. ZERO BIAS - scores, article reviews, protocol conditions and more https://www.bioz.com/product/pires+plasmid/pIRES-EGFP-puro+(Plasmid+%2345567)/pmc12825063-47-0-2 Average 93 stars, based on 1 article reviews
pires egfp pac - by Bioz Stars,
2026-09
93/100 stars
|
Buy from Supplier |
|
Addgene inc
flag addgene 16257 pires neo3 clontech 631621 aspn d14 Flag Addgene 16257 Pires Neo3 Clontech 631621 Aspn D14, supplied by Addgene inc, used in various techniques. Bioz Stars score: 93/100, based on 1 PubMed citations. ZERO BIAS - scores, article reviews, protocol conditions and more https://www.bioz.com/product/pires+plasmid/HER2+WT+(Plasmid+%2316257)/pmc12406728__jciinsight-10-187151-s057-88-282-283 Average 93 stars, based on 1 article reviews
flag addgene 16257 pires neo3 clontech 631621 aspn d14 - by Bioz Stars,
2026-09
93/100 stars
|
Buy from Supplier |
|
Addgene inc
pires 2 egfp vector Pires 2 Egfp Vector, supplied by Addgene inc, used in various techniques. Bioz Stars score: 93/100, based on 1 PubMed citations. ZERO BIAS - scores, article reviews, protocol conditions and more https://www.bioz.com/product/pires+plasmid/pIRES2-EGFP+Mer+(Plasmid+%2314998)/bio_rxiv__2025__07__16__665058-25-17-21 Average 93 stars, based on 1 article reviews
pires 2 egfp vector - by Bioz Stars,
2026-09
93/100 stars
|
Buy from Supplier |
|
Addgene inc
pires neo flag ha eyfp  Pires Neo Flag Ha Eyfp, supplied by Addgene inc, used in various techniques. Bioz Stars score: 92/100, based on 1 PubMed citations. ZERO BIAS - scores, article reviews, protocol conditions and more https://www.bioz.com/product/pires+plasmid/pIRESneo-FLAG%2FHA+EYFP+(Plasmid+%2310825)/pmc12226020-200-15-19 Average 92 stars, based on 1 article reviews
pires neo flag ha eyfp - by Bioz Stars,
2026-09
92/100 stars
|
Buy from Supplier |
|
Addgene inc
michael mcvoy Michael Mcvoy, supplied by Addgene inc, used in various techniques. Bioz Stars score: 93/100, based on 1 PubMed citations. ZERO BIAS - scores, article reviews, protocol conditions and more https://www.bioz.com/product/pires+plasmid/pIRES-EGFP-puro+(Plasmid+%2345567)/pm40533368-212-29-31 Average 93 stars, based on 1 article reviews
michael mcvoy - by Bioz Stars,
2026-09
93/100 stars
|
Buy from Supplier |
|
Addgene inc
mammalian expression vector pires cyofp1  Mammalian Expression Vector Pires Cyofp1, supplied by Addgene inc, used in various techniques. Bioz Stars score: 93/100, based on 1 PubMed citations. ZERO BIAS - scores, article reviews, protocol conditions and more https://www.bioz.com/product/pires+plasmid/NHR1%2B2-Flag+pcDNA3%2E1+(Plasmid+%2317316)/bio_rxiv__2025__03__28__646046-36-15-20 Average 93 stars, based on 1 article reviews
mammalian expression vector pires cyofp1 - by Bioz Stars,
2026-09
93/100 stars
|
Buy from Supplier |
|
Addgene inc
pires hrgfp ii tet1 cd Pires Hrgfp Ii Tet1 Cd, supplied by Addgene inc, used in various techniques. Bioz Stars score: 93/100, based on 1 PubMed citations. ZERO BIAS - scores, article reviews, protocol conditions and more https://www.bioz.com/product/pires+plasmid/pIRES-hrGFP+II-TET1_CD+(Plasmid+%2383570)/pmc12081649-16-0-3 Average 93 stars, based on 1 article reviews
pires hrgfp ii tet1 cd - by Bioz Stars,
2026-09
93/100 stars
|
Buy from Supplier |
|
Addgene inc
pires hrgfp ii mtet1 Pires Hrgfp Ii Mtet1, supplied by Addgene inc, used in various techniques. Bioz Stars score: 93/100, based on 1 PubMed citations. ZERO BIAS - scores, article reviews, protocol conditions and more https://www.bioz.com/product/pires+plasmid/pIRES-hrGFP+II-mTET1+(Plasmid+%2383569)/pmc12081649-15-0-3 Average 93 stars, based on 1 article reviews
pires hrgfp ii mtet1 - by Bioz Stars,
2026-09
93/100 stars
|
Buy from Supplier |
Image Search Results
Journal: eLife
Article Title: The human cytomegalovirus-encoded pUS28 antagonizes CD4+ T cell recognition by targeting CIITA
doi: 10.7554/eLife.96414
Figure Lengend Snippet: ( A ) Schematic overview of the structure of pUS28. All structural parts of the protein and the DRY motif are indicated. Mutation of the arginine in this motif to alanine (R129A) ablates G-protein coupling. This panel was created using BioRender.com . ( B ) HeLa cells were either left untreated or were co-transfected with CIITA-3xFLAG expression construct and pcDNA:US28-HA, pcDNA:US28-R129A-HA, pIRESNeo-FLAG/HA-EYFP, or empty vector. At 24 hr post-transfection, protein lysates were generated and analyzed by immunoblot using antibodies detecting the indicated proteins or the respective epitope tags. ( C ) HeLa cells were either left untreated or were co-transfected with CIITA-3xFLAG expression construct and pcDNA:US28-HA, pcDNA:US28-ΔC-HA, pIRESNeo-FLAG/HA-EYFP (control) or empty vector. At 24 hr post-transfection, protein lysates were generated and analyzed by immunoblot using antibodies detecting the indicated proteins or the respective epitope tags. ( D/E ) HeLa cells were either left untreated or were co-transfected with CIITA expression construct and pcDNA:US28-HA, pcDNA:US28-R129A-HA, pIRESNeo-FLAG/HA-EYFP (control) or empty vector. At 48 hr post-transfection, cells were stained with anti-HLA-DP ( D ) or anti-HLA-DR ( E ) antibodies and analyzed by flow cytometry. Cell surface expression of HLA-DP or HLA-DR was normalized to cells co-transfected with CIITA expression construct and empty vector. The percentage of HLA-DP- and HLA-DR-positive cells is shown (n=3). The different transfection conditions were compared to the control condition (vector) by one-way ANOVA test. Additionally, US28-R129A-HA was compared to US28-HA. Comparisons are shown when statistically significant. ( F/G ) HeLa cells were either left untreated or were co-transfected with CIITA-3xFLAG expression construct and pcDNA:US28-HA, pcDNA:US28-ΔC-HA, pIRESNeo-FLAG/HA-EYFP (control) or empty vector. At 48 hr post-transfection, cells were stained with anti-HLA-DP ( F ) or anti-HLA-DR ( G ) antibodies and analyzed by flow cytometry. Cell surface expression of HLA-DP or HLA-DR was normalized to cells transfected with CIITA expression construct and empty vector. The percentage of HLA-DP- and HLA-DR-positive cells is shown (n=3). The different transfection conditions were compared to the control condition (vector) by one-way ANOVA test. Additionally, US28-ΔC-HA was compared to US28-HA. Comparisons are shown when statistically significant. ( H ) HeLa cells were either left untreated or were transfected with CIITA-3xFLAG expression construct or pcDNA:US28-ΔC-HA. At 24 hr post-transfection, protein lysates were generated and an IP with HA-specific mouse monoclonal antibody was performed either with unmodified samples or with mixed samples of CIITA- and US28-transfected cells. The lysates and IP samples were analyzed by immunoblot to test CIITA and pUS28-ΔC co-precipitation. ( I ) HeLa cells were either left untreated or were co-transfected with CIITA-3xFLAG expression construct and pIRES:US28-HA, different pIRES:US28-ΔC-HA mutants, pIRESNeo-FLAG/HA-EYFP (control) or empty vector. At 24 hr post-transfection, protein lysates were generated and analyzed by immunoblot using antibodies detecting the indicated proteins or the respective epitope tags. Untrans, untransfected. Vector, empty vector control. ΔC (1-297), C-terminal (aa 298–354) deletion mutant of pUS28. 1–313, C-terminal (aa 314–354) deletion mutant of pUS28. 1–329, C-terminal (aa 330–354) deletion mutant of pUS28. 1–345, C-terminal (aa 346–354) deletion mutant of pUS28. R129A, point mutation mutant of pUS28. Control, pIRESNeo-FLAG/HA-EYFP. Figure 7—source data 1. PDF files containing original western blots for , indicating the relevant bands and treatments. Figure 7—source data 2. Original files for western blot analysis displayed in .
Article Snippet: Cells were transfected with the following plasmids: pUNO1-hCIITA (Invitrogen), pRP-humanCIITA-3xFLAG (VectorBuilder), pRP-3xFLAG-mouseCIITA (VectorBuilder), pcDNA3.1(+) (Invitrogen),
Techniques: Mutagenesis, Transfection, Expressing, Construct, Plasmid Preparation, Generated, Western Blot, Control, Staining, Flow Cytometry
Journal: bioRxiv
Article Title: Functional profiling of KCNE1 variants informs population carrier frequency of Jervell and Lange-Nielsen syndrome type 2
doi: 10.1101/2025.03.28.646046
Figure Lengend Snippet: Averaged whole cell current traces from cells expressing KCNE1 variants in the homozygous state. Each trace represents JNJ-303 sensitive currents from an average of 21-126 cells co-expressing KCNQ1 with the indicated KCNE1 variant. Currents were normalized to peak current in cells expressing WT KCNE1 and WT KCNQ1 recorded in parallel. Scale bars represent 25% of WT (vertical) and 500 ms (horizontal). Location of variants is indicated by the colored labels (green = N-terminus; orange = TM domain; blue = C-terminus).
Article Snippet: Full length cDNA encoding WT KCNQ1 (GenBank accession number AF000571 ) was engineered in the
Techniques: Expressing, Variant Assay

Journal: bioRxiv
Article Title: Functional profiling of KCNE1 variants informs population carrier frequency of Jervell and Lange-Nielsen syndrome type 2
doi: 10.1101/2025.03.28.646046
Figure Lengend Snippet: Peak current density for KCNE1 variants in the homozygous state. JNJ-303 sensitive peak whole-cell currents measured at +60 mV from CHO-K1 cells co-expressing WT KCNQ1 with KCNE1 variants plotted as fold difference from WT channels recorded in parallel. ( A ) Variants in the N-terminus (green symbols). ( B ) Variants in the transmembrane domain (orange symbols). ( C ) Variants in the C-terminus (blue symbols). All individual data points are plotted as open symbols and mean values are shown as filled symbols with error bars representing the 95% CI. Values to the right or left of the vertical dashed line (normalized WT value) represent current density larger (gain-of-function) or smaller (loss-of-function) than WT, respectively. The number of recorded cells for each variant and individual P -values are presented in Supplemental Dataset 1 .
Article Snippet: Full length cDNA encoding WT KCNQ1 (GenBank accession number AF000571 ) was engineered in the
Techniques: Expressing, Variant Assay

Journal: bioRxiv
Article Title: Functional profiling of KCNE1 variants informs population carrier frequency of Jervell and Lange-Nielsen syndrome type 2
doi: 10.1101/2025.03.28.646046
Figure Lengend Snippet: Averaged whole cell current traces from cells expressing KCNE1 variants in the heterozygous state. Each trace represents JNJ-303 sensitive currents from an average of 38-131 CHO-E1 cells coexpressing KCNQ1 with the indicated KCNE1 variant. Currents were normalized to peak current in CHO-E1 cells co-expressing WT KCNE1 and WT KCNQ1 recorded in parallel. Scale bars represent 25% of WT (vertical) and 500 ms (horizontal). Location of variants is indicated by the colored labels (green = N-terminus; orange = TM domain; blue = C-terminus).
Article Snippet: Full length cDNA encoding WT KCNQ1 (GenBank accession number AF000571 ) was engineered in the
Techniques: Expressing, Variant Assay
Journal: bioRxiv
Article Title: Functional profiling of KCNE1 variants informs population carrier frequency of Jervell and Lange-Nielsen syndrome type 2
doi: 10.1101/2025.03.28.646046
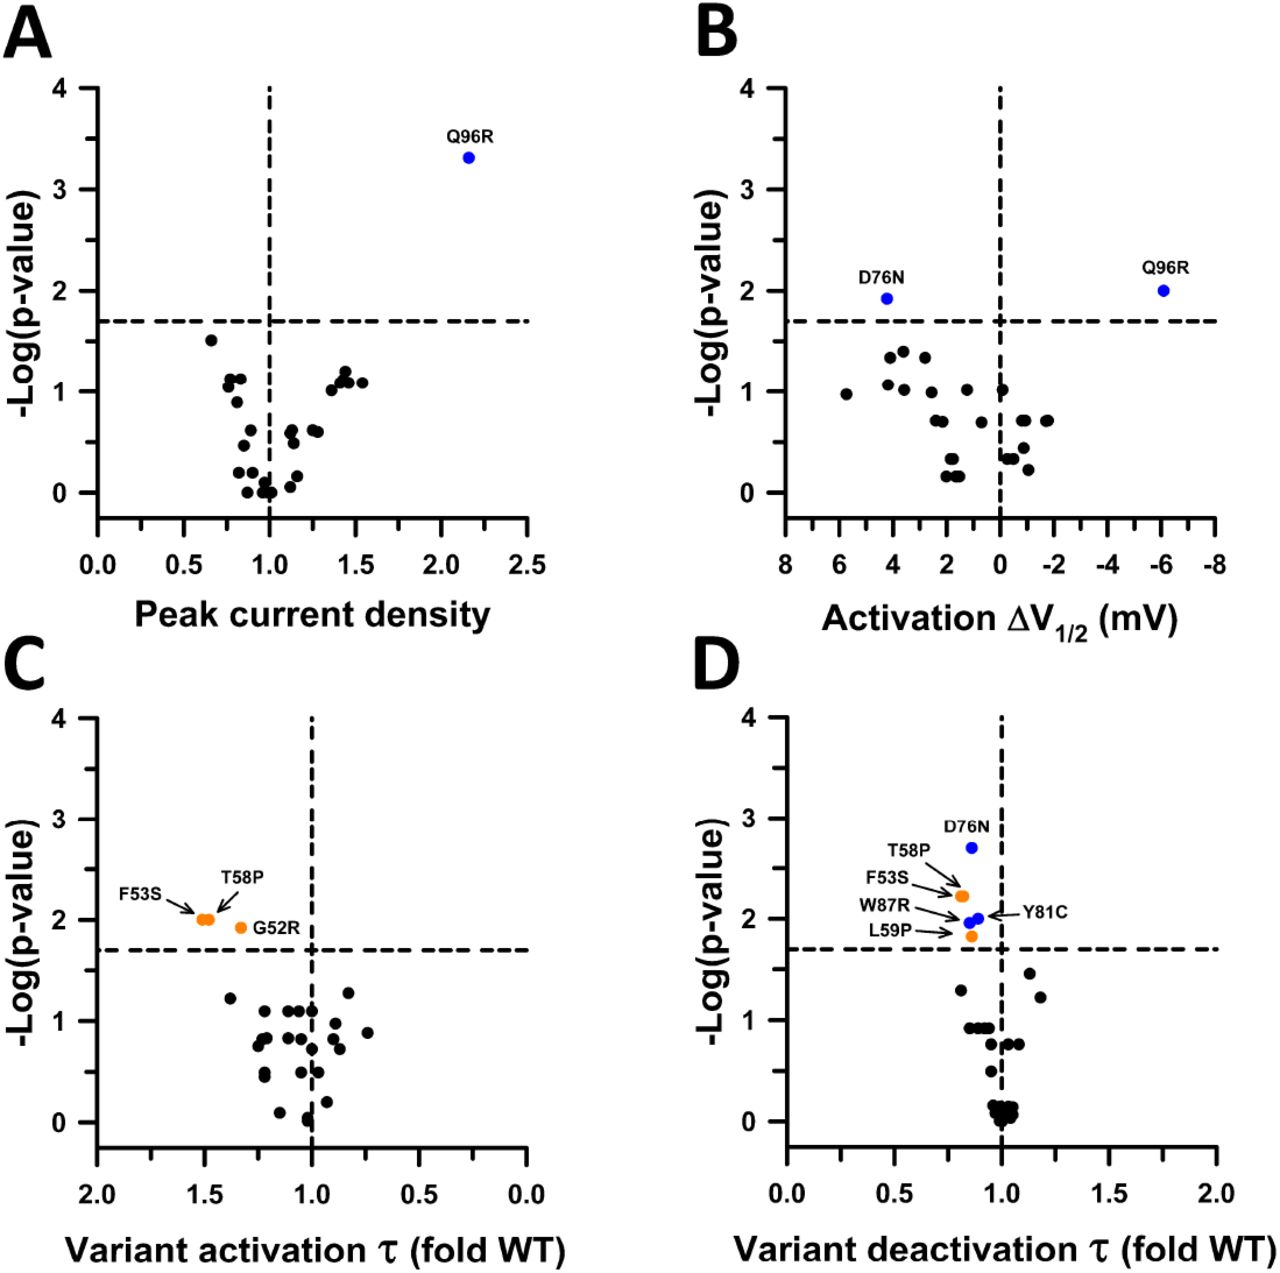
Figure Lengend Snippet: Functional properties of KCNE1 variants in the heterozygous state. ( A ) Volcano plots of mean JNJ-303 sensitive peak whole-cell current density measured at +60 mV from CHO-E1 cells co-expressing WT KCNQ1 with each KCNE1 variant. Data are displayed as fold divergence from WT channels recorded in parallel. Only variants with peak current density significantly different from WT ( P < 0.02, horizontal dashed line) are labeled. Values to the right or left of the vertical dashed line (normalized WT value) represent current density larger or smaller than WT, respectively. ( B ) Volcano plots of mean difference (ΔV½ in mV) between the averaged V½ for variant and WT channels recorded in parallel. Only variants with peak current density significantly different from WT (P<0.02, horizontal dashed line) are labeled. Values to the right or left of the vertical dashed line indicate hyperpolarized or depolarized activation V½, respectively. ( C ) Volcano plots of mean activation time constants (τ) determined for each heterozygous KCNE1 variant plotted as the ratio to the averaged activation time constant for WT channels recorded in parallel. Values to the right or left of the vertical dashed line (no difference from WT) indicate faster or slower activation, respectively. ( D ) Volcano plots of mean deactivation time constants (τ) determined for each heterozygous KCNE1 variant plotted as the ratio to the averaged deactivation time constant for WT channels recorded in parallel. Values to the right or left of the vertical dashed line indicate slower or faster deactivation, respectively. Symbols colors are defined in previous figures. The number of recorded cells for each variant and individual P -values are presented in Supplemental Dataset 2 . Scatter plots of individual data are presented in Supplemental Figure S8 .
Article Snippet: Full length cDNA encoding WT KCNQ1 (GenBank accession number AF000571 ) was engineered in the
Techniques: Functional Assay, Expressing, Variant Assay, Labeling, Activation Assay

Journal: bioRxiv
Article Title: Functional profiling of KCNE1 variants informs population carrier frequency of Jervell and Lange-Nielsen syndrome type 2
doi: 10.1101/2025.03.28.646046
Figure Lengend Snippet: Functional properties of KCNE1 variants in the heterozygous state. ( A ) Average JNJ-303-sensitive peak whole-cell current density measured at +60 mV from CHO-E1 cells co-expressing WT KCNQ1 with each KCNE1 variant. Data are displayed as fold divergence from WT channels recorded in parallel. Values to the right or left of the vertical dashed line (normalized WT value) represent current density larger or smaller than WT, respectively. ( B ) Activation voltage-dependence for each heterozygous KCNE1 variant plotted as the difference (ΔV½ in mV) between the averaged V½ for WT channels recorded in parallel. Values to the right or left of the vertical dashed line indicate hyperpolarized or depolarized activation V½, respectively. ( C ) Activation time constants (τ) determined for each heterozygous KCNE1 variant plotted as the ratio to the averaged activation time constant for WT channels recorded in parallel. Values to the right or left of the vertical dashed line (no difference from WT) indicate faster or slower activation, respectively. ( D ) Deactivation time constants (τ) determined for each heterozygous KCNE1 variant plotted as the ratio to the averaged deactivation time constant for WT channels recorded in parallel. Values to the right or left of the vertical dashed line indicate slower or faster deactivation, respectively. Location of variants is indicated by the colored symbols (green = N-terminus; orange = TM domain; blue = C-terminus). The number of recorded cells for each variant and individual P -values are presented in Dataset 2 .
Article Snippet: Full length cDNA encoding WT KCNQ1 (GenBank accession number AF000571 ) was engineered in the
Techniques: Functional Assay, Expressing, Variant Assay, Activation Assay

Journal: bioRxiv
Article Title: Functional profiling of KCNE1 variants informs population carrier frequency of Jervell and Lange-Nielsen syndrome type 2
doi: 10.1101/2025.03.28.646046
Figure Lengend Snippet: Correlation of peak current density with functional and trafficking scores from a KCNE1 deep mutation scan. ( A ) Plot of peak current density measured in cells co-expressing WT KCNQ1 with KCNE1 variants (homozygous state) compared with the Functional Score reported for each variant determined by a cell fitness assay. ( B ) Plot of peak current density measured in cells co-expressing WT KCNQ1 with KCNE1 variants (homozygous state) compared with the reported Trafficking Score for each variant. In both plots, solid blue lines represent a linear regression fit to the data with 95% CI shown as light blue shadow.
Article Snippet: Full length cDNA encoding WT KCNQ1 (GenBank accession number AF000571 ) was engineered in the
Techniques: Functional Assay, Mutagenesis, Expressing, Variant Assay
Journal: bioRxiv
Article Title: Functional profiling of KCNE1 variants informs population carrier frequency of Jervell and Lange-Nielsen syndrome type 2
doi: 10.1101/2025.03.28.646046
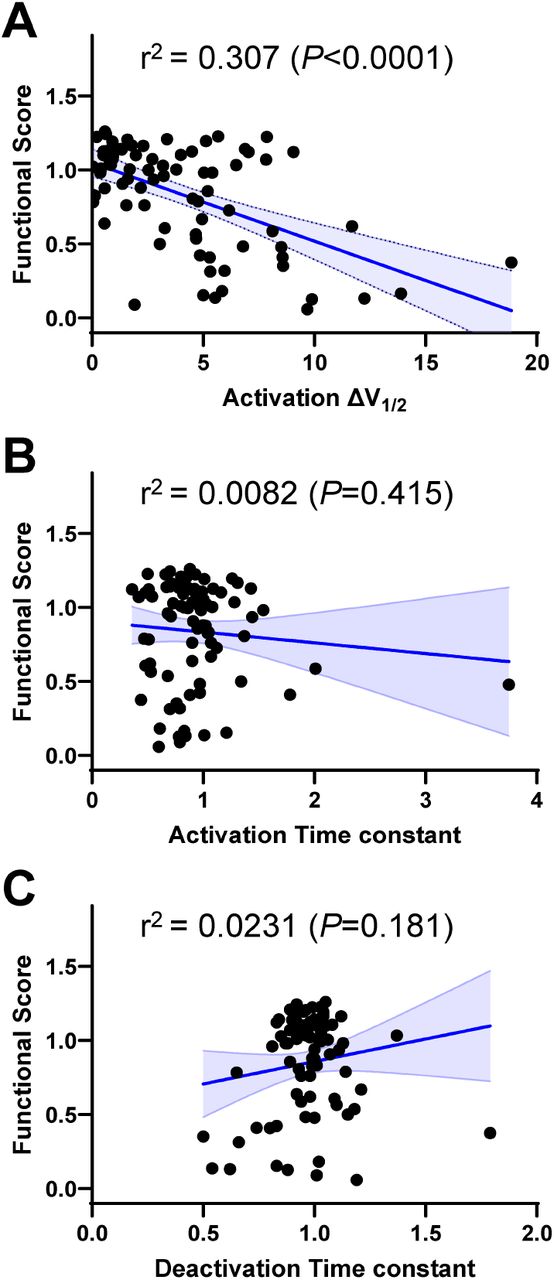
Figure Lengend Snippet: Correlation of biophysical properties with functional scores from a KCNE1 deep mutation scan. ( A ) Plot of differences in activation V½ (ΔV½ in mV) measured in cells co-expressing WT KCNQ1 with KCNE1 variants (homozygous state) compared with the Functional Score reported for each variant determined by a cell fitness assay. ( B ) Plot of differences in activation time constants measured in cells co-expressing WT KCNQ1 with KCNE1 variants (homozygous state) compared with the reported Functional Score. ( C ) Plot of differences in deactivation time constants measured in cells co-expressing WT KCNQ1 with KCNE1 variants (homozygous state) compared with the reported Functional Score.
Article Snippet: Full length cDNA encoding WT KCNQ1 (GenBank accession number AF000571 ) was engineered in the
Techniques: Functional Assay, Mutagenesis, Activation Assay, Expressing, Variant Assay